
Hybrid-electric vehicles (HEV)
2002-21-0033
Electronics as the Cornerstone of Future
Fuel-efficient and Clean Vehicles
Dr. Alex Severinsky
Theodore Louckes
Robert Templin
Fred Frederiksen
Paice Corporation
Copyright © 2002 Society of Automotive Engineers
ABTRACT
In this paper we present three main principles for commercially viable hybrid-electric vehicles:
1) using ICEs only near maximum thermodynamic efficiency,
2) using a high voltage electric power subsystem for reduced losses,
3)using only existing automobile materials and processes for low cost.
One implementation of these principles is presented in a popular American SUV using our Hyperdrive hybrid-electric powertrain. We will show that driving performance can be enhanced while towing capacity, climbing capacity, and top speed can be preserved without compromise. Fuel economy can be improved by over 50% and regulated emissions can be reduced to near background level. All components of the system are analyzed and it is shown that a 300 V based electric subsystem is materially inferior to the 800 V system in fuel economy, driving performance and cost.
In discussing components, we substantiate the case for using a lead-acid battery system. We also show that the main enabler for a commercially viable HEVs is a high voltage power semiconductor.
In summary, it is electronics – power semiconductors, inverters, batteries, electric motors, and computer controllers with sophisticated software – that is the cornerstone of future powertrain technology for fuel-efficient, clean, and economical automobiles.
INTRODUCTION
It is well established today that hybrid-electric vehicles can substantially increase fuel economy and simultaneously reduce harmful regulated exhaust emissions. There is also generally thought that such improvements come at a certain price – poor driving performance, modest overall improvements, and substantially higher costs.
In this paper we present an HEV technology that we call “Hyperdrive” which combines the following four main characteristics:
• As an HEV, it increases fuel economy to near theoretical maximum
• It allows reduction of regulated emissions to near ambient level without any appreciable cost
• It allows for material and easily recognizable improvement in driving performance
• It offers an opportunity for same or lower cost in mature volume
This technology amplifies advantages of HEVs and dispels the myth of HEVs shortcomings.
From business standpoint, all component technologies are ready for implementation now, and development, tooling, and re-tooling costs are relatively low in comparison with any other conventional new vehicle development and tooling program.
The enabler for this technology is electronics. Most important is semiconductor technology of high voltage power semiconductors, currently IGBTs. Secondly, it is the technology of lead-acid batteries for stand-by applications for telecommunications. All the advantages can only be achieved through pervasive computer control of all components.
THREE FUNDAMENTAL PRINCIPLES FOR ECONOMICAL AND EFFICIENT HEVs
FIRST PRINCIPLE
The ICE is the most efficient converter of chemical to mechanical energy for vehicle applications. The internal combustion engine – gasoline spark ignition, diesel compression ignition, and anything in between – is the most energy efficient converter of energy from natural fuels into mechanical energy to drive an automobile when maximum driving effort is required. There are numerous rigorous studies proving this point (12) . It is important to note another source – the keynote speech delivered at the meeting of Russian Academy of Science devoted to its 250th anniversary by its former President, academician Peter Kapitza. He presented the case for economical energy production from physics standpoint with conclusion that there must be high volumetric density of flow, any flow, of any substance, as a source of energy. For example, coal or nuclear electric power plants are economical as there are high
densities of heat flow. Contrary, solar and wind sources of energy are uneconomical as there is no real density in light or wind power. There is low flow in fuel cells.
Engines must be used in the region of minimum or near minimum BSFC (Break Specific Fuel Consumption). From physics standpoint, it means that thermodynamic efficiency when measured on the output drive shaft shall be close to its maximum, as defined by the thermodynamic cycle. We emphasize that the laws of physics determine the limits because there is no engineering that can overcome them.
In existing automobiles, engines are not used in that region most of the time. For example, an average efficiency of gasoline engines over range of driving conditions experienced by all drivers together is in 18-22% range, as a function of product positioning, while the maximum efficiency is around 35%.
We developed our technology specifically to realize 33-34% average efficiency for the gasoline engine. It means that we can improve fuel economy on average around 50%. This thermodynamic limit of 35% cannot be overcome and this explains the failure of all prior attempts to increase fuel economy by 100% or more.
There is also a similar case for diesel engines or any other engine between spark ignition gasoline and compression ignition diesel. In the case of diesel, the improvement is lower, in 30-40% range as diesel engines are used more efficiently, at the price of reduced driving performance and higher cost.
We control any engine in such a way that it operates near maximum thermodynamic efficiency practically all the time. The enabler for this method of control is electronics, hence the name of this paper.
SECOND PRINCIPLE
Electronics need to be able to drive the vehicle at all times when the engine can’t be used at or near minimum BSFC.
Electrical and electronic components must provide traction effort to the automobile when the engine can’t be used efficiently, which means that it must be powerful. Powerful electronics will consume substantial energy for its own operation and will reduce energy delivered to the wheels unless it is specifically designed for low energy losses.
It is a principle of electric power distribution that its efficiency, or low internal losses, is higher with higher voltages and accordingly lower currents. This fundamental
principle is applied to the Hyperdrive’s powerfulelectrical/electronic system.
Moreover, and equally importantly, the ratio of voltage to current is a function of cost, exactly like in electrical power distribution. We select system voltage to maximize
performance-to-cost ratio.
THIRD PRINCIPLE
Cost must be on par with current costs. This includes material costs, processing costs, and amortization of tooling costs.
One significant aspect of automotive production is that the dominant factor of cost is incremental cost, and development and tooling cost amortized per vehicle are so low that for planning purposes they are easily assumed to be zero.
There are two major parts to incremental cost – direct material cost and processing time cost. In order to achieve parity or even advantage in comparisons with conventional automobile cost, we must use existing materials and existing manufacturing processes.
This limits our selection of materials to steel, copper, aluminum, lead, and silicone, and to existing manufacturing processes.
It is also interesting to note that by so limiting selection of materials, incremental cost analysis in automotive volumes can be done with only three basic measuring tools – a scale for weight, a ruler for size, and a chronometer for processing time. Other values are well known – commodity material costs and the cost of a unit of processing time as a function of production location.
BENCHMARK AMERICAN SUV
We have analyzed performance of a number of popular American SUVs. In Fig. 1 below we show the typical appearance of such a benchmark SUV.
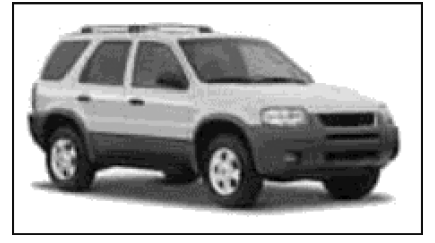
Fig. 1: Popular American SUV used for Hyperdrive implementation.
The performance data summarized in Table 1 is representative of an average blend for numerous vehicles, not specific to the vehicle shown in Fig.1. We will use the representative data as a benchmark for this paper.
| Basic Configuration | |
| Engine | 3.0L V-6 |
| Transmission | 4-speed AT |
| Drive wheels | 4X4 |
| Max towing capacity | 3,500 lbs. |
| Fuel Economy | |
| ETW | 3,800 lbs. |
| FUDS | 20 MPG |
| HWFET | 30 MPG |
| Combined (55/45) | 24 MPG |
| Performance | |
| PTW | 4,000 lbs. |
| 0-60 MPH | 11 sec |
| 55-75 MPH | 7 sec |
| 35-55 MPH | 4 sec |
| Top Speed Continuous | 105 mph |
| Continuous Gradeability | |
| GCW | 8,200 lbs. |
| Gradeability @ 80 MPH | 5.5 % |
| Starting Grade | 30 % |
| Emissions | |
| CO | 8.1 g/mi |
| NOx | 0.9 g/mi |
| HC | 0.2 g/mi |
Table 1: Benchmark SUV fuel economy, performance, emissions
HYPERDRIVE FOR BENCHMARK SUV (1,2,3,4,5)
In Fig. 2, we present a diagram illustrating the mechanical and electrical components of one of the many varieties of our system, as designed for this benchmark SUV.
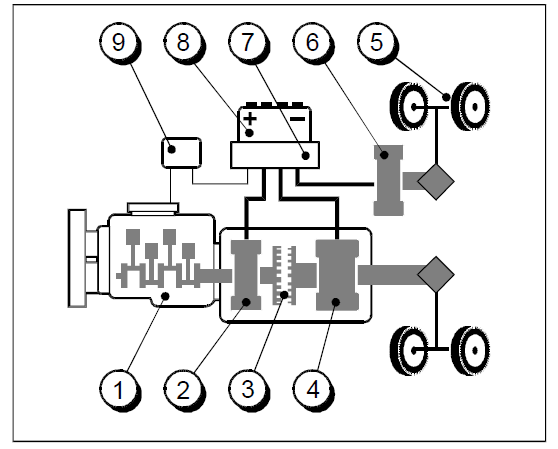
Fig. 2: Hyperdrive configuration for benchmark SUV.
1 – 2.0L TC I-4
2 – 15 kW starter/charger motor
3 – Clutch
4 – 45 kW traction motor
5 – Front wheels
6 – 15 kW traction motor
7 – Inverters
8 – Batteries, 16 modules, 50 V, 18 lbs. each, lead-acid
9 – Drive and battery controller.
TYPICAL MODES OF OPERATION
There are four typical modes of operation that we use to demonstrate the basic functionality of our system. Besides these four, there are a number of other modes as defined in the control algorithms.
The system has a discrete position device, the clutch. The vehicle road load usually controls its position via overall control algorithm. Only if this load is sufficient for the engine to operate at its near-minimum BSFC is the clutch engaged,otherwise it is disengaged.
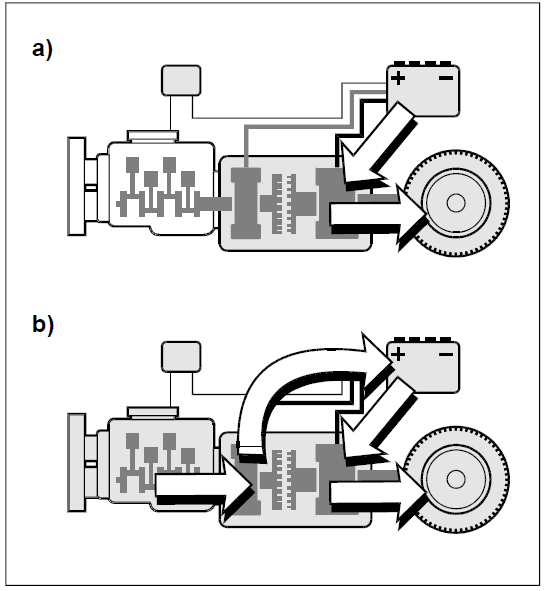
Fig. 3. Typical Hyperdrive operation in city driving. A) An Electric Car; B) A Serial Hybrid and a Range Extender
In Figure 3, the clutch is disengaged. In part A of Fig. 3, the lead-acid battery system (LABS) is above its minimum state of charge, and the vehicle is driven by two traction motors Only one traction motor is shown in Figures 3 and 4 for simplicity. There is a second traction motor in Figure 2 for this SUV application. This is the pure electric car mode of operation. Contrary to typical electric car operation however, the battery is used only over a narrow range of discharge, typically in a range of 50% to 70% state of charge (SoC) to assure long battery life. The amount of energy used in this electric only mode is well below the PNGV definition of a “dual mode hybrid”. Our system operates primarily as anelectric car during city operation.
In part B of Fig. 3, the LABS has reached its minimum state of charge of 50%, and the charger/starter motor starts the
engine. Once started, the engine is loaded by the same motor (now a generator) as a charger and is operated at its nearminimum BSFC point. The power produced by the charger is split. One part is delivered to the traction motor. The system is now operating as a serial hybrid. The rest of the power recharges the LABS. This makes our system a range extender as well. When the LABS reaches the maximum SoC level, the engine is shut off.
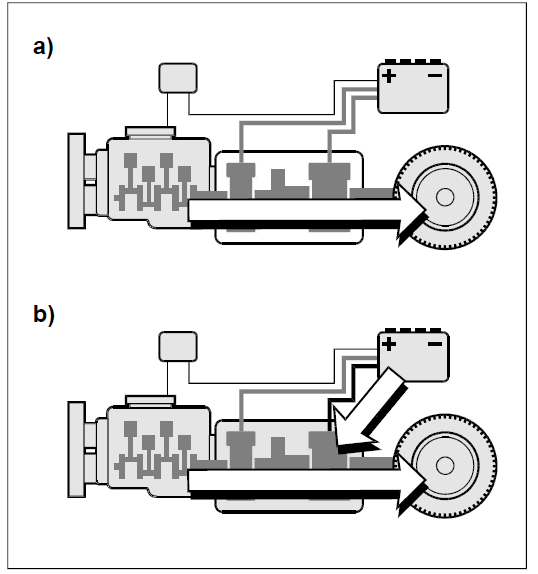
Fig. 4. Typical Hyperdrive operation in highway driving. A) An ICE car B) Parallel Hybrid
When the sensors report and the central controller determines that there is enough road load torque to allow ICE operation at the near-minimum BSFC region, the clutch is engaged. If the engine was off before this controller demand, the engine is started and synchronized. Now it is the engine that provides the average power level demands (less transient demands) of the vehicle. The system operates as a conventional drive train. This is depicted in part A of Fig. 4.
For vehicle acceleration or deceleration, all three motors are used as a function of minimum energy loss in all electrical and electronic components. The controller is assuring this on millisecond-by-millisecond basis. Acceleration in a parallel mode is shown in part B of Figure 4. The engine torque is lagging motor torque to assure operation at only stoichiometric air/fuel mixture, which is the basis for the optimum emission control provided by the three-way catalyst control system.
As electric motors provide essentially instant torque response to the driver’s demands, noticeable levels of car
responsiveness can be provided, even varying the shape of this response to optimize traction capability.
COMPONENTS IN GENERAL
The ENGINE is selected to meet maximum grade ability specifications at all speeds and loads on a continuous basis, except starting grade.
The battery can’t be used on a continuous basis for obvious reasons. The most economical engine type is a spark-ignition ICE with a mild turbocharger, which is normally off (6,7). Nothing in our system prohibits a choice of Diesel ICE, however, depending on the customer’s desires and / or regulatory requirements.
All electric motors together must have enough combined starting torque to assure mobility on a steep incline. A key
feature of induction motors is their “transmission-like” capability below rated speed. Their typical constant power
range of operation is over a 4:1 speed range. Additionally, both peak power and its duration must assure high
acceleration and passing performance.
The CHARGER/STARTER MOTOR is selected to load the engine in the “de-clutched” condition to provide the best ratio
of BSFC/motor cost. There are varieties of well-known ways of mechanical coupling of this motor to the engine shaft,
which are dependent on mechanical packaging for a specific vehicle.
The TRACTION MOTORS must provide main torque for starting on a grade. This is in addition to the torque of the
charger/starter motor minus engine motoring torque. From a power standpoint, the traction motors together must be able to drive the SUV when the engine is “de-clutched”. The ratio of power rating of these motors is defined by the needs of vehicle dynamics. This arrangement of electrical 4×4 offers substantial flexibility to automotive engineers in improving vehicle handling and safety under variable load, load distribution, and variable road conditions.
Both traction motors are coupled mechanically to the drive shafts in the customary way with the overriding criteria of
minimal cost.
The CLUTCH acts as a switch. It is either engaged or disengaged by the controller when the two shafts’ angular
positions and first derivatives over time are equal within an error of measurements, for example 1o for angles. When so controlled, it can be a low cost mechanical device. The Lead-Acid Battery System (LABS) consists of 16
modules, 50 V each. The module content is so different from a traditional battery that we call it a Hybrid Energy Module (HEM).
The CONTROLLER, Powertrain Control Module (PCM) takes the place of an Engine Control Module (ECM) and
becomes much more important. An existing ECM becomes a peripheral device along with each motor controller, battery system controller, and a few other peripheral controllers customary in vehicles. The controller hardware must support a massively parallel DSP computation. The key elements of our system that allows it to deliver the advantages in both performance and cost are in the control algorithms.
COMPONENTS IN DETAIL
EFFICIENT USE OF THE ENGINE
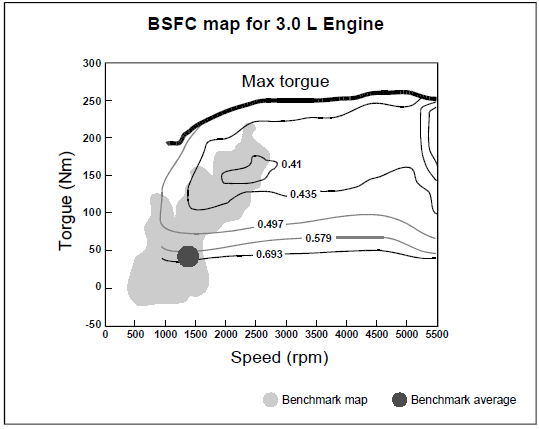
Fig. 5A. Map of benchmark engine operation on FUDS
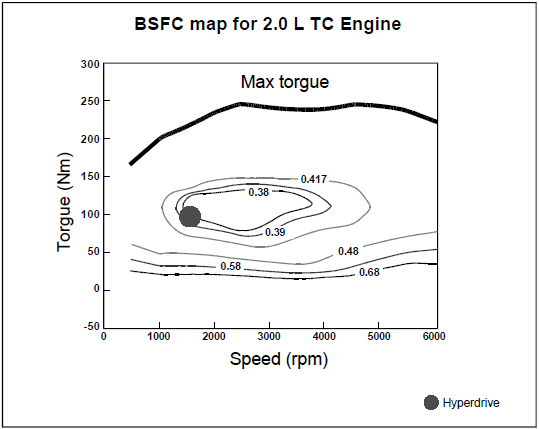
Fig. 5B. Map of engine operation in the Hyperdrive on FUDS. One operating point.
On Fig. 5A, we present the range of loading of the engine in the benchmark SUV, while driving on Federal Urban Driving Schedule, the ubiquitous FUDS. For ease of engineering judgment, we also calculated the average point based on the integral of fuel flow and the average engine speed. In this case, the average BSFC is 0.62 lbs./hp-h.
On Fig. 5B, we present the operating point of the engine on the same FUDS in our system with the clutch always in the disengaged position. Now, the BSFC is 0.39 lbs./hp-h. This is a 59% increase in fuel economy of the engine utilization over the benchmark SUV. There are even more fuel efficient control algorithms.
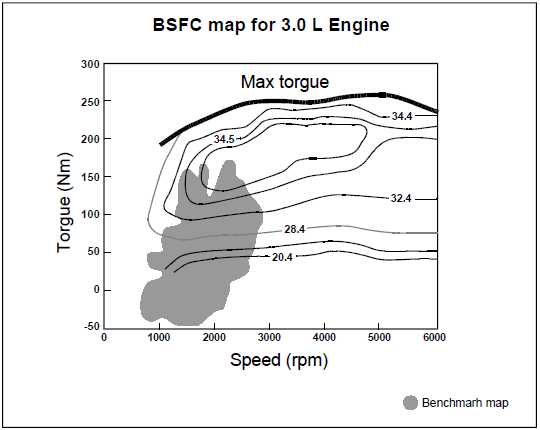
Fig. 6A. Map of engine operation in the benchmark SUV on HWFET
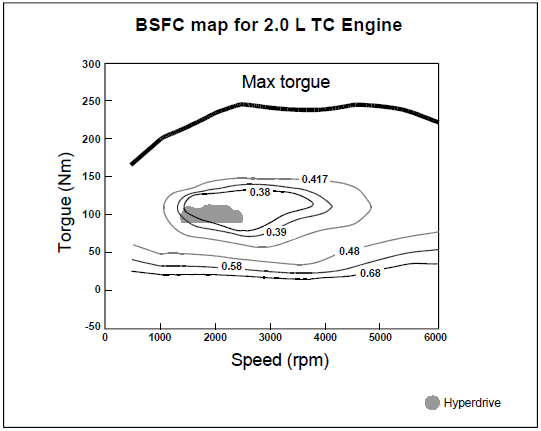
Fig. 6B. Map of engine operation in the Hyperdrive on HWFET
In Fig. 6 A and B, we present the same comparison on HWFET (Highway Fuel Economy Test procedure), formerly
FHWC. During this driving cycle, the clutch is mostly engaged. One can easily note that in our system, the engine is
not used below some minimum torque level. We depicted just a straight line, but other functions are even more desirable for even better fuel economy.
These two examples of engine control clearly represent the first principle of our HEV – operate the engine only near
maximum fuel (thermodynamic) efficiency. This method of engine control opens a new chapter for engineering of the next generation of ICEs for HEV applications such the one we have developed. These opportunities were presented by one of the co-authors last year (7).
SIZING OF EFFICIENT MOTORS
In this configuration, we use an induction motor with peak rating of 45 kW and continuous rating of 12 kW. It is
attached to the output drive shaft via a speed reducer. The top motor speed is 16,000 rpm. Efficiency of this motor is nearly independent of the battery voltage, as these motors are transformers. In Fig. 7, the efficiency map for this motor is shown. This map represents specific physical size of the motor to provide shown efficiency in the desired operating region.
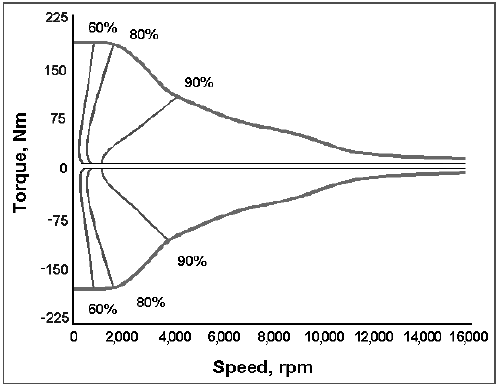
Fig. 7. Traction motor efficiency map, in %
For the second motor, we use an induction motor with peak rating of 15 kW and continuous rating of 4 kW. This motor is similarly sized to meet the efficiency map shown in Fig. 7. The electrical 4×4 drive can be made more controllable under variable road and load conditions than a mechanical drive. It also will have lower fuel consumption, especially in a stopand-go city driving, due to the larger amount of recovered regenerative energy from the other set of wheels. Finally, we use a 15 kW charger motor, also similarly sized to meet the efficiency map of Fig. 7.
HIGH VOLTAGE INVERTERS- an example at 800V
The inverters are key performance and cost components of our system. First, the choice of semiconductors is limited to IGBTs (insulated gate bipolar transistors), rated at 1,400 V for the 800 V system. Secondly, quasi-lossless snubbers are used to reduce switching losses. Thirdly, we use input and output filters. With the input L-C filter, pulsating currents caused by PWM (Pulse Width Modulation) to and from the batteries are reduced. The output filter reduces switching current losses in the motors. Both filters also allow reduced cost EMI suppression.
To demonstrate the advantage of higher voltage, we have designed two inverters: one for the 800 V battery and one for the 300 V battery, using our test data for the other components in the system. Then, we calculated conduction and switching losses for each pulse in PWM waveform. The summary of this analysis is presented in Table 2.
| Table 2. Inverter Losses, % | ||
|---|---|---|
| Rated Power,% | 800 V battery | 300 V battery |
| 100 | 2.6 | 7.3 |
| 50 | 3.7 | 7.3 |
| 10 | 3.9 | 11.5 |
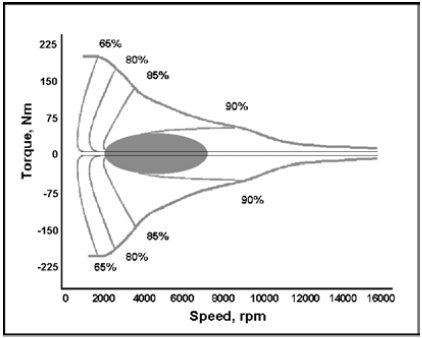
Fig. 8A. Traction Motor/Inverter utilization in city driving with 800 V battery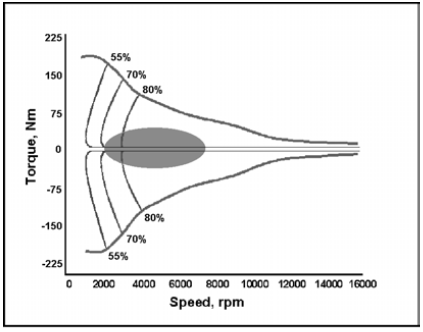
Fig. 8B. Traction Motor/Inverter utilization in city driving with 300 V battery
Numbers represent efficiency in percent Shaded area is main operating region
We summarized the effect of losses in both traction motors and inverters in city driving in Figure 8 below.
The shaded area shows the main operating region of the traction motors on FUDS. The substantially lower operating
efficiency at 300 V versus 800 V is clearly indicated.
BATTERY
LEAD-ACID BATTERY TECHNOLOIGY
STATE-OF-THE-ART
Our system provides near maximum performance / cost value for any given battery technology. The cost of the battery subsystem will define the speed and volume of market penetration for this and any HEV technology. Lead-acid technology provides for the highest potential for rapid market penetration.
In general, there are two main battery characteristics that are required for HEV application: power density and cycle life.
Lead-Acid Battery Power Density
Rowlette and Attia in a paper published in 1986(10) studied the comparative power densities of various types of materials for batteries. They defined a figure of merit for comparison. The essential equation is:
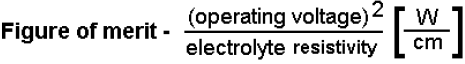
Their findings are summarized in the following table.
| Lead-Acid | 3.93 |
| Li(Al)-FeS | 2.76 |
| H2-O2 (fuel cell) | 2.20 |
| Ni-H2 (NiMH) | 0.95 |
| Na-S | 0.92 |
Table 3: Energy density of various energy storage systems
The results clearly demonstrate the superiority of lead-acid electrochemistry for power density. This is also why lead-acid technology has been used to the exclusion of all others in all automobiles for the last 100 years.
Lead-Acid Battery Projected Cycle Life
Figure 9 shows the battery usage for our system over a typical
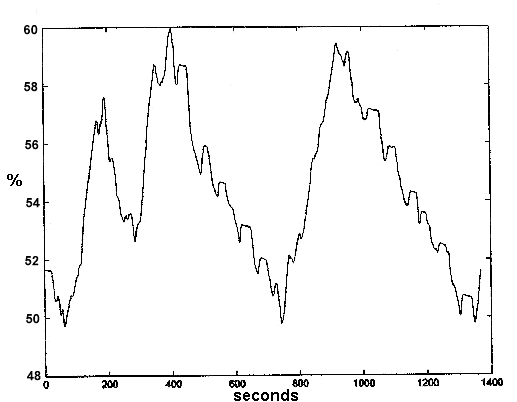 Fig 9: Battery usage on FUDS, in % SoC
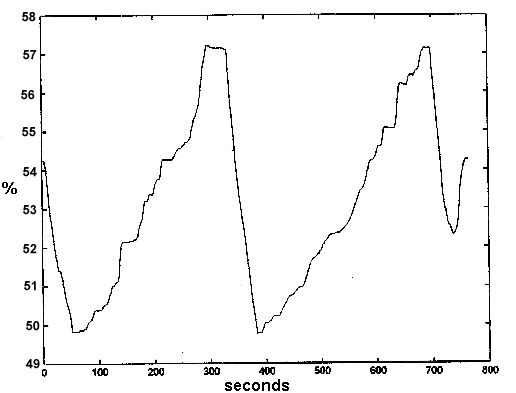
Fig 9b: Battery usage on HWFET, in % of SoC
city and highway cycle. As is shown, the battery capacity is used in our system in the following way. In city driving, it is used 22% over a distance of 7.5 miles. In highway driving, it is used 15% over a distance of 10 miles. Using the standard 55/45 combined formula, this results in an average of 2.3% charge/discharge per mile (See Table 4 below).
| SoC | Distance | |
| FUDS | 22% | 7.5 mi |
| HWFET | 15% | 10 mi |
| 55/45 Combined | 2.3 % / mile | |
Below we summarize approximately five (5) year old state-ofthe-art of cycle life test results. In electric vehicle applications lead-acid batteries provide 1,000 cycles with 100% discharge each. This is 100,000% of charge/discharge. It defines minimum capacity utilization.
Newnham & Baldsing (11) tested cycle life of lead-acid batteries without acid stratification (see chart below). They conducted a study in which they put a lead-acid battery through 5,500 cycles with 30% charge and discharge
(equivalent to 165,000% of charge / recharge) and found that 98% of the capacity of the lead-acid battery remained – Fig.10.
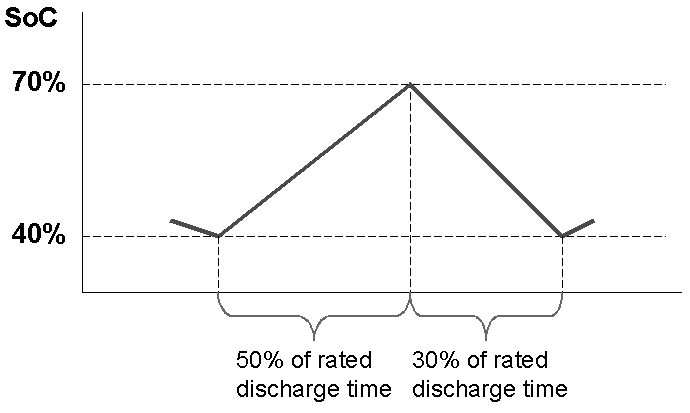
Fig 10: Newnham & Baldsing test cycle
Lead-acid battery professionals view is that for HEV applications, the end of cycle life of lead-acid batteries is over 200,000%. In the application that we are discussing in this paper and based on Newnham test results, battery will last 165,000 / 2.3 ≈ 72,000 miles without any degradation ofperformance. Based on the end of cycle life predictions of 200,000%, these batteries will last over 87,000 miles in our application.
At average vehicle usage in the United States of 12,000 miles annually, it means that the batteries will show no degradation in 72,000 / 12,000 = 6 years, and end of life at over 7 years. This duration is longer than calendar life for most batteries, so future design efforts may be directed at extending calendar life as much as cycle life.
Another phenomena affecting cycle life is RMS value of actual currents, and not only lower frequency harmonics
represented in overall cycle life testing by Newnham. Again, this is a power density phenomenon. The higher the power
density, the lower is current surface density and the smaller is this effect.
Construction detail
The word “battery” may be misleading in this case. The system uses a Lead-Acid Battery System (LABS). It consists
of several 50 V modules. Each module contains 24 lead-acid cells. The modules are connected in series and the electrical center point of this string is connected to the chassis, per Underwriter’s Laboratories recommendation, as a better solution from a safety engineering standpoint. This allows the voltage rating of all components to be reduced to half of the total LABS voltage. Each module has an internal normally open disconnect with an air-gap. This assures absence of any voltage on the module terminals during shipment, assembly, service, or when the vehicle is turned off or in an accident. The module contains three important subsystems – a thermal equalizer, an electronic operational conditioner, and a computer interface. Further details are too voluminous for this paper and will be reported separately. The module content is so different from a traditional battery that it is better designated a Hybrid Energy Module (HEM).
For this vehicle, the system needs 6 Ah cells, and 16 modules with a total string voltage of 800 V. The energy capacity is 4.8 kWh. These cells will need to have an end-of-life power density of 500 W/kg, the level well within existing state-ofthe-art. With existing manufacturing technology, this will result in minimum thickness of all layers in the cell.
Effect of battery voltage
For the 300 V string, there will be 6 modules. The capacity of the cell, however, will have to be much greater than 4.8 kWh, to sustain the same cycle life as in the 6 Ah cell. The reason is that the cell internal resistance changes with temperature, similar to an effect observed in bipolar transistors. The cell internal resistance is reduced
approximately in half for each 10oC temperature rise. Such behavior creates a so-called “current crowding” effect, which was the main cause of failure of initial SCRs circa 1960.
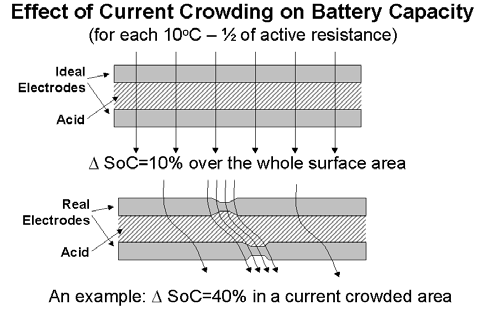
Fig 11. Current crowding effect.
Current crowding will cause only a part of the electrode surface to be utilized, resulting in a much larger swing in the state-of-charge over portions of the electrode and consequently faster wear-out. To ameliorate this problem, cell
current density must be reduced. Following the experience from paralleling bipolar transistors with total current almost three times of each, this dictates de-rating the current density by 1/2. This calls for 100% proportionally more surface area than expected to achieve a satisfactory 6 Ah cell cycle life. Without the possibility of reducing layer thickness, this will dictate a nominal 32 Ah cell, with 100% more weight and cost.
We have tested the efficiency of the closest available prototype of the needed cell, the Hawker Energy Product’s
Genesis 13 Ah battery, using currents actually experienced in our tests. We found through two different measuring
techniques that the roundtrip energy efficiency is 88-90% while coulombic efficiency is close to 100%.
In summary, in high power density application of lead-acid cells as required in HEVs, we need approximately double size, weight, and cost of a battery system at 300 V than at 800 V.
PRIOR TEST RESULTS USED FOR MODEL CALIBRATION
We had constructed our system with the following major components: SI, I-4, 1.3 L normally aspirated engine, with 70
hp maximum power; 15 hp charger/starter; 100 hp peak traction motor; LABS to be operated at 6.5 Ah capacity in the
string of 16 modules, 50 V each; inverters based on 1,400 V rated IGBTs.
A representative picture of this implementation of our HEV design on the dynamometer is shown below:
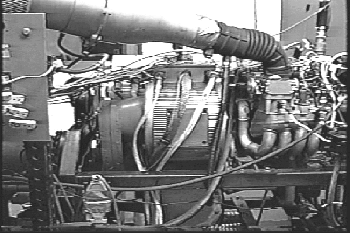
Fig 12: Hyperdrive on the test stand.
We tested our system with a load representing a U.S. luxury sedan. The inertia load was 4,250 lbs. and the road load was programmed by using A,B, and C coefficients of the polynomial approximating the load as a function of speed.
We have measured the following fuel economies.
| Conventional | Hyperdrive | |
| City (FUDS) | 19 MPG | 38 MPG |
| Highway (HWFET) | 33 MPG | 54 MPG |
| Combined | 24 MPG | 44 MPG |
Table 5: Hyperdrive test results: fuel economy
To verify the results, we measured heat losses in all components and compared them with the amount of fuel used.
The results were in agreement. Moreover, these tests showed there is room for further improvements in city cycle fuel
economy of at least 10%.
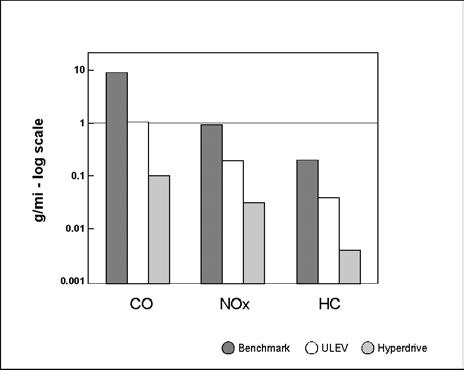
Fig 13: Hyperdrive emissions compared to benchmark and ULEV. Test data
Additionally, we measured the following improvements in exhaust emissions shown in Fig. 13. These emissions were
measured on the FUDS cycle and not FTP75. The data represent the worst-case scenario. The engine that we used
was not an automotive engine, but a marine engine, so its engine-out emissions were approximately four times larger
than for an engine of automotive variety. Nevertheless, we achieved quite low emissions, below not only ULEV, but also below SULEV. We used a computer-controlled, pre-heated, off-the–shelf catalyst. The engine was calibrated to operate with our method of control. Some emissions like HC were so low (at background levels) that we needed more sensitive and dynamic analysis equipment for further testing. Consequently, HC emissions results are preliminary. Similar reductions in emissions were reported in another report (8) . The bottom line is that emissions are so low during ICE operation and zero during electric mode operation that it is difficult to expect any further reductions from automobiles. Compared to today’s cars, the car with our HEV drive, without any further emissions development, is already 95 percent below today’s emission standards, yet does not suffer the serious compromises which have doomed the market acceptance of other approaches to zero-emission cars.
DESIGN RESULTS IN BENCHMARK VEHICLE
In Table 5 below we present the results of Matlab/Simulink design of the Hyperdrive in the benchmark SUV.
Comparative Performance |
|||
| Benchmark | Hyperdrive | Hyperdrive | |
| BatteryVoltage | 800 V | 300 V | |
| Engine | 3.0L V-6 | 2.0L I-4 TC | 2.0L I-4 TC |
| Transmission | 4-speed AT | None | None |
| Drive wheels | 4X4 | 4X4 | 4X4 |
| Max towing capacity | 3,500 lbs. | 3,500 lbs. | 3,500 lbs. |
| Fuel Economy | |||
| ETW | 3,860 lbs. | 3,970 lbs. | 4,250 lbs. |
| FUDS | 20 MPG | 40 MPG | 27 MPG |
| HWFET | 31 MPG | 38 MPG | 34 MPG |
| Combined(55/45) | 24 MPG | 39 MPG | 30 MPG |
| Performance | |||
| PTW | 3,970 lbs. | 3,970 lbs. | 4,250 lbs. |
| 0-60 MPH | 10.8 sec | 7.4 sec | 8.0 sec |
| 55-75 MPH | 6.7 sec | 4.7 sec | 5.0 sec |
| 35-55 MPH | 4.3 sec | 2.7 sec | 3.0 sec |
| Top Speed Continuous | 106 mph | 106 mph | 104 mph |
| Continuous Gradeability | |||
| GCW | 8,200 lbs. | 8,200 lbs. | 8,200 lbs. |
| Gradeability @80 MPH | 5.5 % | 5.6 % | 5.3% |
| Starting Grade | 30.0 % | 30.1 % | 30.0% |
| Emissions, g/mi | |||
| CO | 8.1 | 0.1 | 0.1 |
| NOx | 0.9 | 0.03 | 0.03 |
| HC | 0.2 | 0.004 | 0.004 |
Table 5: Comparative fuel economy, performance, emissions at 800 V and 300 V.
Firstly, let’s analyze the results for the 800 V system. From construction standpoint, in our drive there is a smaller and lighter engine, 2.0 L turbocharged I-4 instead of the benchmark 3.0 L V-6. The transmission and the transfer case are eliminated. Batteries are added. We estimated the net increase of weight from 3,860 lbs. for the benchmark to 3,970 lbs. for our drive SUV.
From performance standpoint, our HEV will pull the same trailer, climb the same grades, and run at the same top speed
as the benchmark. It will also accelerate and pass significantly faster than the benchmark, with 7.4 seconds 0-60 mph versus 10.8 seconds, and 2.7 seconds in 35-55 mph versus 4.3 seconds. This significantly improved acceleration and passing ability is easily recognizable by the drivers.
Fuel economy improvements are significant, from 24 mpg to 39 mpg, over 60% improvement.
To estimate emissions, we used our data for a 1.3 L engine and increased them proportionately to a 2.0 L engine,assuming the same high engine out emissions and the same operation of the exhaust cleaning system.
The results for the same system at 300 V are interesting for comparison. From weight standpoint, more batteries were
required to assure the same cycle life, so the test weight had to be increased from 3,860 lbs. to 4,250 lbs. Performance remains more or less the same, but acceleration is slower, top speed is lower, and high speed grade climbing capability is lower, all due to higher weight. Also, the extra batteries will reduce the size of the available cargo compartment.
What is most instructive is the large decrease in fuel economy when compared to the 800 V system. The main cause is not the weight difference, but inverter efficiency. In city driving when the electrical system is used all the time, fuel economy comes down from 40 mpg in the 800 V system to 27 mpg for the 300 V system, which is still well above 20 mpg for the benchmark. On the highway, the electrical system is used intermittently and the fuel economy reduction for the lower voltage system is also smaller, from 39 mpg to 34 mpg, compared to 31 mpg in the benchmark. Consequently, overall combined improvement in fuel economy is only 25% for the 300 V system versus over 60% for the 800 V system.
COMPARATIVE ECONOMICS OF THE ELECTICAL SUBSYSTEM, 800 V AND 300 V
Our estimate is that the most economical DC voltage for this SUV application is in the range of 600-800 V — substantially higher than in existing HEVs with voltages in 140-280 V range – depending on the application. For illustration purposes, we compare the relative costs of 800 V and 300 V systems.
The main cost elements are the inverters. In Table 6 we present comparative cost of inverters at two different voltages.
| Table 6. Comparative Cost of Inverters.In Relative Units of Cost | ||
| Major parts/assemblies | 800 V battery | 300 V battery |
| Power Semiconductors | 1.0 | 2.5 |
| Power Capacitors | 1.0 | 2.7 |
| Filter Inductors | 1.0 | 2.7 |
| Snubbers | 0.5 | 1.0 |
| Controls | 1.0 | 1.0 |
| Cooling | 0.3 | 3.0 |
| Packaging | 0.5 | 1.0 |
| TOTAL | 5.3 | 13.7 |
The relative costing of major components came out of our design at two different voltages. It is important to note that one can use air-cooling at 800 V, but liquid cooling is required at 300 V. This is due to of substantially higher losses at 300 V. In summary, the low voltage inverters will cost approximately 2.6 times more than the high voltage ones.
The next cost element is the HEM. In a low voltage system, as we have already demonstrated, we need 100% more cell
capacity to assure cycle life. This causes a proportional increase in cost.
The next cost issue is wiring and electrical safety disconnects. As power dissipation is proportional to the square of current,we will need six times more material content to control heat during peak performance at 300V. We estimate that the resulting cost will be at least four (4) times higher for the lower voltage system.
300 V battery
| Table 7. Relative Costs of the Electrical System | ||
| 800 V battery | ||
| Inverters | 1.0 | 2.6 |
| Motors | 1.0 | 1.0 |
| LABS | 1.0 | 2.0 |
| Wiring. safety | 0.5 | 2.0 |
| Total | 3.5 | 6.6 |
Based on our prior experience in cost estimates for components, we placed their relative costs in the 800 V
column. For the 300 V column, we factored in considerations presented above. In this example, the total cost of a low
voltage system will be approximately 90% higher than that of a high voltage system.Thus, there are two main advantages of higher voltage: increased fuel efficiency and decreased cost. This is graphically depicted below.
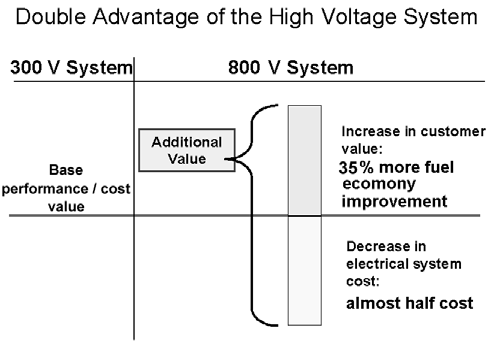
Fig 14: Advantages of the higher voltage system
As depicted above, the first advantage of higher voltage is that the inverter losses are lower. In turn, these lower losses at high voltage increase overall vehicle fuel economy. In our earlier report (9), we have shown that due to higher voltage fuel economy for European light commercial vehicles increases by 1/3rd in comparison with a low voltage implementation.
Other effects of higher voltage are a substantial reduction in lead-acid battery system weight and cost, and an overall
decrease in electrical subsystem cost almost in half in comparison with a low voltage version. In summary, higher
voltage has a double impact on the value of the Hyperdrive, providing more value in terms of fuel economy and reducing system costs at the same time.
It is especially important to note that a 300 V system makes an HEV not economical but an 800 V system does. High voltages IGBTs are enablers of commercial viability of HEVs and uniquely of our system.
ADDITIONAL COST CONSIDERATIONS
In a prior report (13), we had presented cost analysis of our HEV in similar and larger SUVs. The result is that it will add less than 10% to the existing vehicle cost with existing state of- the-art electrical subsystem components.
In estimating future delta in cost, we may keep in perspective the existing costs in automobile industry. For example,
gasoline engines cost around $4/lb., automatic transmissions – $10/lb., lead-acid batteries – $1/lb., electric motors – $2/lb. These numbers are proportional to processing time. So, in the future, the less mechanical components that are used, and the more electrical and electronic ones are present, the lower will be the vehicle cost.
CONCLUSION
We hope that we have presented a convincing case of why electronics is a cornerstone of clean, efficient, and
commercially viable new powertrains.
If an ICE is operated in intermittent mode at high fuel economy, there must be an efficient and economic complementary intermittent energy storage and release subsystem.
Our system brings unique features of electrical, electronic, and software components to automobile powertrains to satisfy this intermittent need. Because of high voltage power semiconductors, our HEV design allows, for the first time, affordable fuel economy improvements of over 50%, reduces emissions to negligible levels, and materially improves performance of automobiles, with no compromise of safety or convenience, yet with more design freedom. Improvement of fuel economy by over 50% causes reduction of CO2 emissions by over 33%.
Uniqueness of our HEV powertrain is in the new method of ICE control, in not allowing the ICE to operate outside its
most fuel-efficient region of operation. This seemingly obvious concept only became economical with the introduction of commercial high voltage power semiconductors.
All component technologies in our powertrain are mature and widely available. The specific components must be designed for a given application.
This technology will have a profound effect on vehicle regulations. Fuel economy and CO2 regulations may become
mute as it is against the laws of physics to improve beyond what is described in this paper, without reducing vehicle size and weight.
REFERENCES
1. United States Patent number 6,209,672, Severinsky, Hybrid Vehicle, issued April 3, 2001.
2. United States Patent number 5,343,970, Severinsky, Hybrid Electric Vehicle, issued September 6, 1994.
3. United States Patent number 6,338,391, Severinsky,Louckes, Hybrid Vehicles Incorporating Turbochargers, issued January 15, 2002
4. United States Patent Application number 09/822,866, Severinsky and Louckes, Hybrid Vehicles, published November 8, 2001. Available at https://www.paice.com/patents/.
5. World Intellectual Property Organization, PCT Patent Application, PCT/US99/18844. Published March 23, 2000. International Publication number WO 00/15455. Title page available at https://www.paice.com/patents/.
6. D. Polletta, Fuel Economy and Performance Impact of Hybrid Drive Systems in Light Trucks, Vans, and SUVs; SAE Bus and Truck Conference, Chicago, Illinois, October 2001, SAE paper 2001-01-2826.
7. Louckes, Theodore and Timbario, Tom, The Hybrid: A Challenge and an Opportunity for IC Engines, Proceedings of
the AVL International Congress on Internal Combustion Engine versus Fuel Cell — Potential and Limitations as Automotive Power Sources, Graz, Austria, September 2001. pp. 145-160.
8. Yamamoto, Yoshihiro, et al., Study on Roadway NMHC Concentrations around Clean Air Vehicles, SAE 1998, paper number 980679
9. A. Severinsky et. al., Effects of High Battery Voltage on Performance and Economics of the Hyperdrive Powertrain, Hybridfahrzeuge und Energiemanagement, Braunschweiger Symposium, February 21, 2002, Technische Universitat Braunschweig.
10. Rowlette, J.J. and Attia, A.I., (Of California Institute of Technology, Jet Propulsion Laboratory), A New Lead-Acid Battery for High Pulse Power Applications, The Electrochemical Society, Inc.’s Second Annual Battery Conference on Applications and Advances, Proceedings Volume 87-16 p.209 (1986).
11. Newnham, R.H. and Baldsing, W.G.A., (of Australia’s Commonwealth Scientific and Industrial Research Organization, Division of Minerals), New Operational Strategies for Gelled-Electrolyte Batteries, Journal of Power Sources 59 (1996), pp. 137-141.
12. Proceedings of the International Congress, “Internal Combustion Engine versus Fuel Cell – Potential and Limitations as Automotive Power Sources” September 6-7,2001, Graz, Austria, by AVL
13. A. Severinsky et al., Hyperdrive as Powertrain Successor, SAE paper 2002-01-1909, FutureCar Congress, June 2002, Arlington, Virginia
ABOUT THE AUTHORS
Dr. Alex J. Severinsky is the inventor of the Hyperdrive. He received his Ph.D. in 1975 in the former Soviet Union. After his successful exit in 1978, he started working on the Hyperdrive in 1979. His American experience is in high voltage power electronics, inverters, lead-acid battery control, DSP based embedded control, and low cost production. Dr. Severinsky is CEO of Paice Corporation.
Ted Louckes has more than 40 years of automobile industry experience, mostly with General Motors where he retired as Chief Engineer of Oldsmobile. He is responsible for the development of the first overhead cam, 4-valve engine for American passenger cars and the introduction of the world’s first air bag system. He serves as the Chief Operating Officer at Paice Corporation.
Robert Templin has also over 40 years of automotive experience, all with General Motors where among other assignments he was Chief Engineer of Cadillac and Director of Research Laboratories. Among his many achievements, he conceived and implemented the first automotive pollution control device ever put into production. He is best known for pioneering digital electronic fuel injection. He serves as a Director of Paice Corporation.
Fred Frederiksen has over 20 years in power electronics and control systems. Has worked on projects demanding high reliability and high efficiency including Uninterruptable Power Supplies (UPS), NYCTA rail car distributed power,
battery powered seismic exploration equipment. Control experience in DSP controlled reconfigurable UPS, DOD
guided missiles, and Tape Automated Bonding (TAB) semiconductor production equipment.
For further information, please visit us at www.paice.com.